The Complete Guide to Trading with Moving Averages: Strategies, analysis, formulas, and real-world examples.
What is a Moving Average
Moving averages represent one of the most fundamental and widely used technical indicators in financial markets. At its core, a Moving average (MA) is a calculation that smooths out price data over a specified period, creating a single flowing line that helps traders identify trends over different time frames, while filtering out random price fluctuations and market noise.
As a trend-following indicator, moving averages help traders determine the general direction of market momentum, identify potential support and resistance levels, and generate trading signals when combined with other indicators or price action analysis.
Unlike more complex indicators, moving averages possess an elegant simplicity that makes them accessible to beginners while remaining invaluable to experienced traders who incorporate them into sophisticated trading systems. Their versatility allows for application across all timeframes and markets, whether you’re day trading with candlesticks and moving averages on one-minute charts or using them for long-term investment decisions on monthly charts.
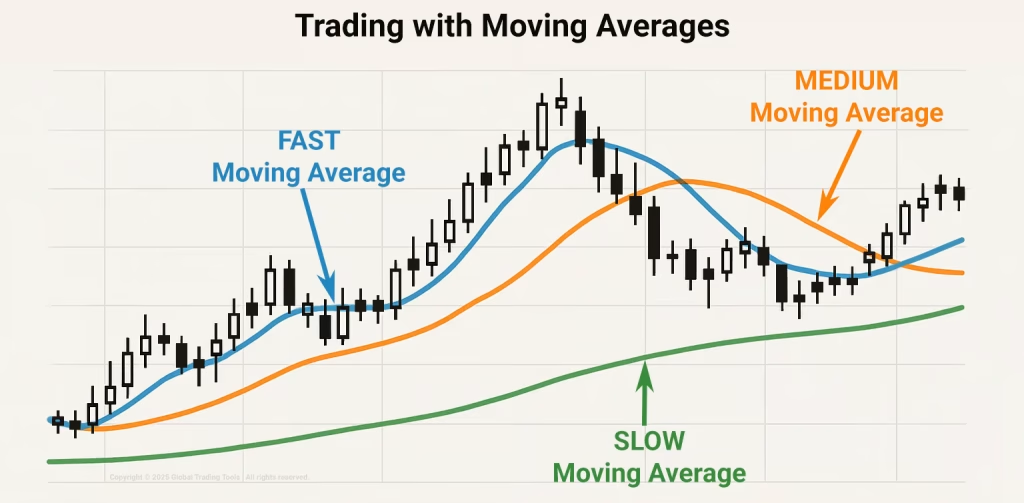
Fast vs Medium vs Slow Moving Averages
Fast moving averages, such as a 5 or 10-period MA, respond quickly to price changes, making them sensitive to short-term fluctuations. This allows traders to capture rapid price movements but also increases the likelihood of false signals.
Medium moving averages, such as the 20 or 50-period, strike a balance by filtering out some noise while still responding to trends in a timely manner. They help traders identify medium-term trends with a reduced risk of whipsaws, compared to faster moving MA’s.
Slow moving averages, such as the 100 or 200-period, provide an even broader perspective by smoothing out price movements over more extended periods. These averages are less reactive and can help traders confirm long-term trends, but may miss shorter-term opportunities.
It’s essential to note that these classifications — fast, medium, and slow are relative. What may be considered fast in one trading strategy may be perceived as slow in another, depending on the trader’s specific goals and time horizon.
How a Moving Average is Calculated
The calculation of a moving average involves taking the arithmetic mean of a set of prices over a defined number of periods. While the concept remains consistent, various types of moving averages calculate this average differently, placing varying degrees of emphasis on recent versus historical price data.
Simple Moving Average (SMA) Formula
The Simple Moving Average represents the most straightforward calculation method. To compute an SMA, you simply add the closing prices for a specified number of periods and divide by that number.
For example, a 10-day SMA would be calculated using the following formula:
10-day SMA = (Day 1 Close + Day 2 Close + ... + Day 10 Close) ÷ 10
Each day, the oldest price drops off, and the newest price is added, creating the “moving” effect. The SMA gives equal weight to all prices in the calculation period.
Exponential Moving Average (EMA) Formula
The Exponential Moving Average addresses a limitation of the SMA by giving greater weight to more recent prices. This makes the EMA more responsive to current price movements.
The EMA calculation involves three steps:
- Calculate the SMA for the initial EMA value.
- Calculate the weighting multiplier: [2 ÷ (number of periods + 1)]. For a 10-day EMA, the multiplier would be 2/(10+1) = 0.1818 or 18.18%.
- Calculate the EMA: [Close – previous EMA] × multiplier + previous EMA. If the previous period EMA is not available, use the previous period SMA instead for the initial calculation.
Weighted Moving Average (WMA) Formula
The Weighted Moving Average assigns a weighting factor to each data point, with the most recent data receiving the highest weight. The weights typically decrease arithmetically.
For a 5-day WMA, the formula would be:
5-day WMA = (Price5 × 5 + Price4 × 4 + Price3 × 3 + Price2 × 2 + Price1 × 1) ÷ (5 + 4 + 3 + 2 + 1)
This gives the most recent price, five times the weight of the oldest price in our example.
Popular Moving Averages Traders Use
Financial markets have evolved substantially over decades, yet certain moving averages have stood the test of time and remain remarkably popular among traders. These “classic” moving averages are frequently referenced in trading literature and widely implemented across trading platforms.
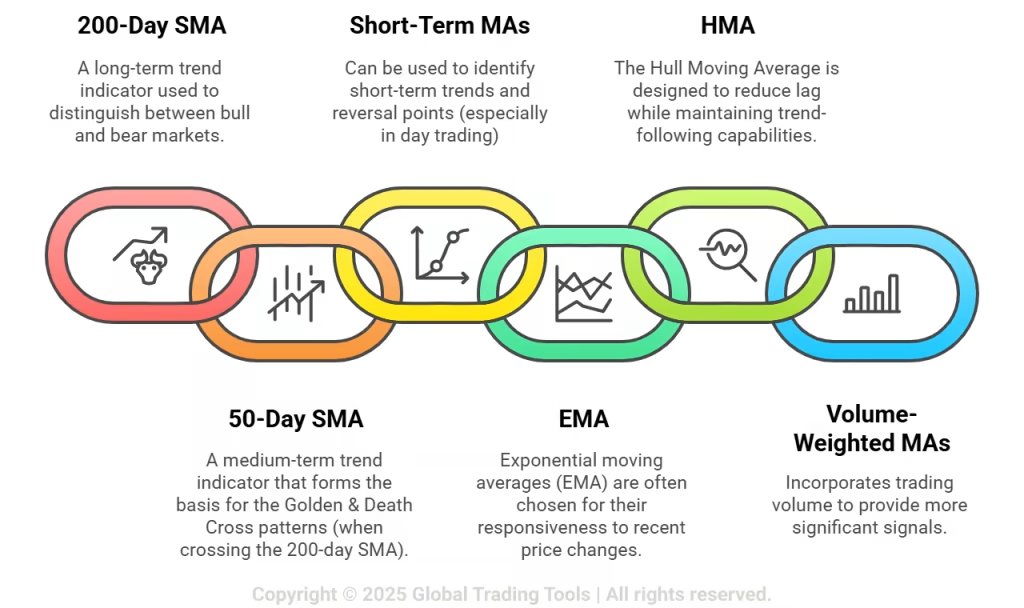
The 200-day SMA
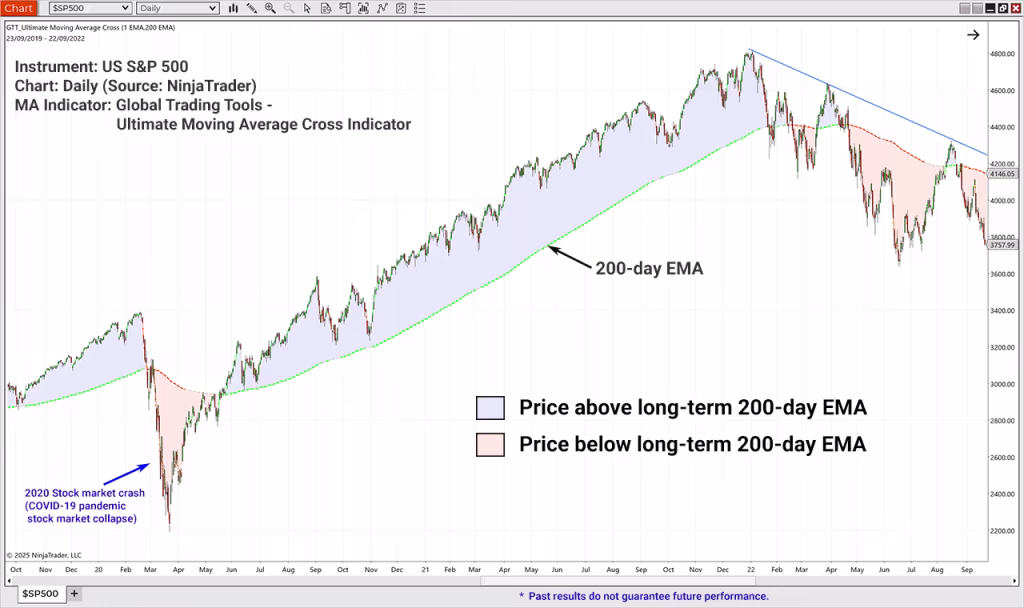
Perhaps the most renowned moving average is the 200-day SMA, often considered the dividing line between bull and bear markets. Institutional investors, fund managers, and long-term traders closely monitor this indicator. When price trades above the 200-day SMA, the market is generally considered bullish; when below, bearish sentiment prevails. Major financial publications regularly reference this moving average when discussing market conditions.
The 50-day SMA
The 50-day SMA serves as a medium-term trend indicator. The interaction between the 50-day and 200-day SMAs creates the famous “Golden Cross” (50-day crossing above 200-day) and “Death Cross” (50-day crossing below 200-day) patterns, which signal potential major trend changes.
Short-term Moving Averages (20, 10, 5)
Short-term moving averages like the 20-period, 10-period, and 5-period are particularly useful for day trading with candlesticks and market structure. These more responsive averages help identify short-term trends and potential reversal points.
Exponential Moving Averages (EMAs)
Many active traders prefer EMAs over SMAs due to their greater responsiveness to recent price changes. Popular EMAs include:
- 8 and 21 EMAs: Favoured by day traders for identifying short-term trends
- 12 and 26 EMAs: Form the basis of the MACD (Moving Average Convergence Divergence) indicator
- 55 and 89 EMAs: Based on Fibonacci numbers and popular among technical analysts
Hull Moving Average (HMA)
Developed to address the lag inherent in traditional moving averages, the Hull Moving Average provides a smoother, more responsive indicator that reduces lag while maintaining the trend-following capabilities of standard moving averages.
Volume-Weighted Moving Averages
These incorporate trading volume into the calculation, giving greater weight to price movements that occur on higher volume, potentially providing more significant signals.
Trading with Moving Averages
Exploring the Importance of Moving Averages in Trading Decisions
Moving averages serve as versatile trading tools that can significantly enhance trading decisions when properly understood and applied. Their importance in technical analysis cannot be overstated, as they provide traders with crucial information about market conditions while filtering out random fluctuations that might otherwise obscure the underlying trend.
Price Smoothing for Clarity
One of the primary functions of moving averages is to smooth price action, making it easier to identify the market’s directional bias. Rather than being distracted by minor price oscillations, traders can focus on the bigger picture. This smoothing effect is particularly valuable in volatile markets where price action alone can appear chaotic and disorienting.
Dynamic Support and Resistance
Moving averages frequently act as dynamic support in uptrends and resistance in downtrends. Price tends to respect these levels, often bouncing off them during retracements. Understanding when to enter a trade with moving averages involves recognizing these support/resistance interactions, which can provide high-probability entry points with clearly defined risk parameters.
Objective Trend Definition
Moving averages provide an objective method for defining market trends. Rather than relying on subjective interpretations of price action, traders can establish concrete rules based on the relationship between price and moving averages. For instance, when price trades above a specific moving average, the market may be considered in an uptrend; when below, in a downtrend.
Market Psychology Reflection
Popular moving averages, particularly on widely followed timeframes, often become self-fulfilling prophecies as large numbers of market participants respond to them similarly. This collective behaviour can reinforce the significance of these levels, making them even more reliable as technical reference points.
Role of Moving Averages in Trend Identification
How to trade with moving averages – The primary function of moving averages in trading is to identify and confirm trends. Their ability to cut through market noise provides traders with clearer signals about the market’s directional bias.
Directional Bias Determination
The relationship between price and a moving average offers immediate insight into the market’s directional bias:
- Price above moving average: Bullish bias
- Price below moving average: Bearish bias
This simple framework helps traders align their strategies with the prevailing trend, improving the probability of successful trades.
Trend Strength Assessment
The distance between price and its moving average provides information about trend strength. A rapidly widening gap suggests strong momentum, while price hugging the moving average may indicate a weakening trend. Additionally, the angle or slope of the moving average itself offers clues about trend strength—a steeper angle indicates a stronger trend.
Multiple Timeframe Trend Alignment
Using moving averages across multiple timeframes allows traders to assess trend alignment, potentially increasing the probability of successful trades. For example, a trader might use a 200-day MA for the primary trend, a 50-day MA for the intermediate trend, and a 20-day MA for the short-term trend. When all three align, it presents a strong case for trading in that direction.
Trend Reversal Signals
Moving averages also help identify potential trend reversals. When price crosses a significant moving average, it may signal a change in market sentiment. These crossovers become particularly noteworthy when accompanied by other confirming factors such as increased volume or candlestick patterns.
Trading Strategies using Moving Averages
What Moving Average to Use?
Selecting the appropriate moving average for your trading strategy requires careful consideration of several factors, including your trading timeframe, market conditions, and personal trading style.
Timeframe Considerations
Your trading timeframe significantly influences the moving average period you should select:
- Scalping (minutes to hours): Very short-term moving averages (5, 8, 13 periods) respond quickly to price changes, providing timely signals for rapid entries and exits.
- Day Trading: 9, 20, and 50-period moving averages on intraday charts strike a balance between responsiveness and noise filtering, making them ideal for day trading with candlesticks and moving averages.
- Swing Trading: 20, 50, and 100-period moving averages help identify intermediate trends while filtering short-term fluctuations, supporting strategies like swing trading with a triple moving average trading system.
- Position Trading: 50, 100, and 200-period moving averages on daily charts provide a broader perspective on market trends, suitable for longer-term position management.
Market Volatility Considerations
Market volatility should influence your moving average selection:
- In highly volatile markets, longer moving averages help filter out excessive noise that might trigger false signals with shorter averages.
- In low volatility environments, shorter moving averages can capture subtle trend changes that longer averages might miss.
Simple vs. Exponential Moving Averages
The choice between SMA and EMA depends on your trading objectives:
- Simple Moving Averages (SMAs): Provide smoother signals with fewer whipsaws, making them suitable for identifying major trend changes and support/resistance levels.
- Exponential Moving Averages (EMAs): Respond more quickly to recent price changes, potentially offering earlier signals for trend reversals at the cost of more false signals.
The Power of Multiple Moving Averages
Many traders implement systems using multiple moving averages simultaneously, particularly when understanding how to swing trade with the triple moving average trading system to ensure they are on the right side of the trend. This approach provides subtle but essential information about market conditions:
- When shorter MAs cross above longer MAs: Bullish signal
- When shorter MAs cross below longer MAs: Bearish signal
- When multiple MAs are stacked in sequence (shortest to longest): Strong trend confirmation
Moving Average Combinations
Many successful strategies employ multiple moving averages together:
- Dual Moving Average System: Combines a faster and slower moving average (e.g., 20 and 50-period) to generate crossover signals.
- Triple Moving Average System: Uses three moving averages (e.g., 5, 20, and 50-period, or for longer-term trades the 20, 50 and 200-period MAs) to confirm trend direction and strength before entering trades.
Popular Moving Average Periods
Certain moving average periods have gained widespread acceptance:
- 20-day: Represents approximately one month of trading days, capturing short-term trends.
- 50-day: Corresponds to about 10 weeks of trading, identifying intermediate trends.
- 200-day: Represents approximately 9-10 months of trading, widely used to determine the long-term market direction.
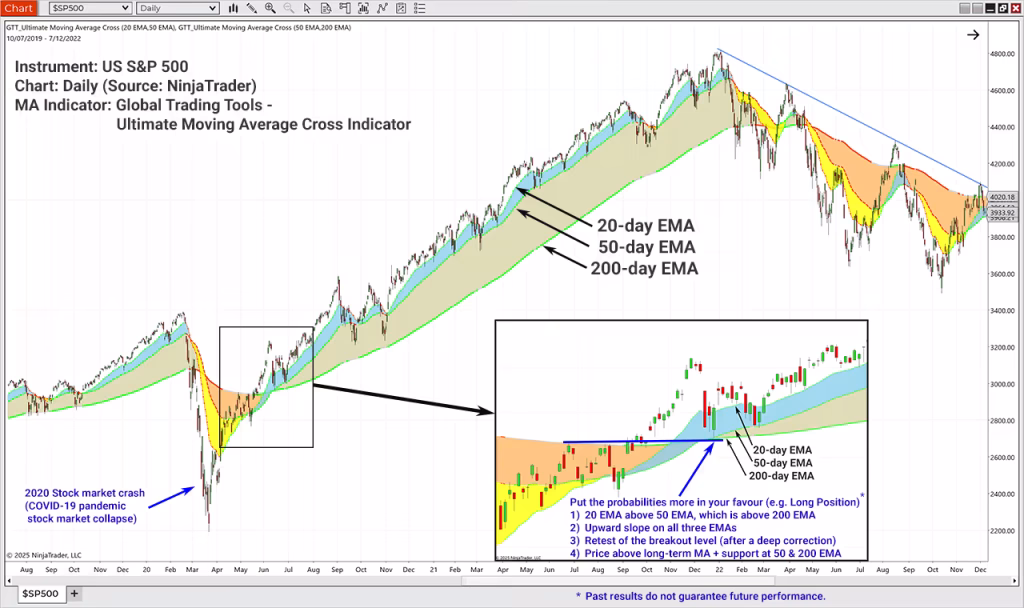
Multiple Moving Average Trade Strategy Example
Put the probabilities more in your favour! The image below shows confluence with multiple factors, including moving averages, market structure and technical analysis patterns. These include:
- 20 EMA is above the 50 EMA, which is above the 200 EMA;
- Upward slope on all three EMAs with widening distance between them;
- Retest of a key breakout level, after a deep correction;
- Price is above the long-term MA; and
- A dynamic support level was found at the 50 EMA at two points.
Please remember that past performance does not guarantee future results.
Mean-reversion and Trend-following Strategies
Moving averages serve as the foundation for two major trading approaches: trend-following and mean-reversion strategies. Understanding how to implement moving averages for each approach can significantly enhance trading results.
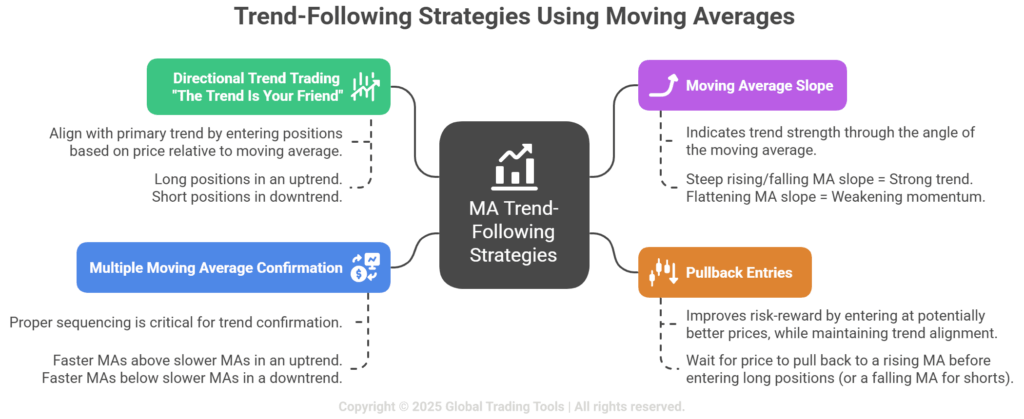
Trend-Following Strategies
Trend-following strategies aim to capture profits by identifying and trading in the direction of established trends. Moving averages excel at defining these trends:
- Directional Trading: Filter long positions to when the price is above a significant moving average (like the 200-day) and short positions when price is below it. This simple approach keeps traders aligned with the primary trend.
- Multiple Moving Average Confirmation: Use several moving averages of different lengths to confirm trend strength. When shorter moving averages are above longer ones and properly sequenced, the uptrend is strong, and vice versa for downtrends.
- Moving Average Slope: The angle of the moving average itself provides valuable information. A steeply rising or falling moving average indicates a strong trend, while a flattening moving average suggests weakening momentum.
- Pullback Entries: Wait for price to pull back to a rising moving average before entering long positions (or a falling moving average for shorts). This approach improves risk-reward by entering at more favourable prices while maintaining trend alignment.
Mean-Reversion Strategies
Mean-reversion strategies exploit the tendency of prices to return to their average or “mean” after moving significantly away from it:
- Overbought/Oversold Identification: When price moves too far from its moving average, it may be overextended. Traders can use percentage or standard deviation bands around moving averages to identify potential reversal points.
- Moving Average Channel Trading: Create channels by placing percentage-based or standard deviation bands around a moving average. When price reaches the upper band, consider short positions; when it touches the lower band, look for long opportunities.
- Moving Average Deviation Strategy: Calculate the percentage deviation between price and its moving average. Extreme deviations often precede reversals toward the average.
- Bollinger Band Squeeze: When price and a moving average come very close together (with narrow Bollinger Bands), it often precedes a significant move. Traders can prepare for breakout trades in either direction.
Hybrid Approaches
Many successful traders combine trend-following and mean-reversion elements:
- Trend-Filter with Mean-Reversion Entry: Use a longer-term moving average to determine the overall trend direction, then use mean-reversion principles to find optimal entry points during pullbacks.
- Timeframe Separation: Apply trend-following on higher timeframes and mean-reversion on lower timeframes, ensuring that mean-reversion trades align with the higher timeframe trend.
Moving Average Crossover Strategy
The moving average crossover strategy represents one of the most widely implemented approaches to trading with moving average crossovers. This method generates signals when faster moving averages cross slower ones, potentially indicating changes in market momentum and trend direction.
The Mechanics of Crossover Strategies
At its core, the crossover strategy involves monitoring the relationship between two or more moving averages of different periods:
- Bullish Crossover: Occurs when a faster moving average crosses above a slower moving average, suggesting upward momentum is increasing.
- Bearish Crossover: Takes place when a faster moving average crosses below a slower moving average, indicating building downward momentum.
Dual Moving Average Crossover System
The simplest implementation uses two moving averages:
- Fast Line: Typically 5-50 periods depending on timeframe
- Slow Line: Usually 20-200 periods
For example, a popular combination is the 50/200 crossover system:
- Buy when the 50-day MA crosses above the 200-day MA
- Sell when the 50-day MA crosses below the 200-day MA
Triple Moving Average Crossover System
Adding a third moving average reduces false signals and provides additional confirmation. This is also the foundation of swing trading with the triple moving average trading system:
- Short-term MA: 5-10 periods
- Medium-term MA: 20-50 periods
- Long-term MA: 100-200 periods
Entry signals typically require:
- Long-term MA defining the primary trend direction
- Medium-term MA crossing the long-term MA confirming trend change
- Short-term MA crossing both longer MAs providing entry timing
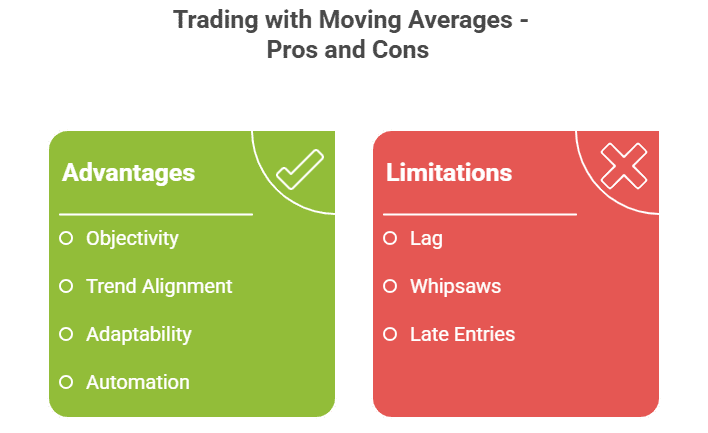
Advantages of Crossover Strategies
- Objectivity: Provides clear, non-subjective signals
- Trend Alignment: Keeps traders on the right side of major trends
- Adaptability: Works across multiple markets and timeframes
- Automation Potential: Easily programmed into trading algorithms
Limitations to be Aware of
- Lag: Crossovers occur after trend changes have begun
- Whipsaws: Frequent false signals in ranging markets
- Late Entries: May miss substantial portions of moves
Enhancing Crossover Strategies to Reduce MA Limitations
To improve the effectiveness of trading with moving average crossovers, consider these enhancements:
- Filter by Market Condition: Only take crossover signals in trending markets; avoid them in ranges.
- Volume Confirmation: Look for increasing volume on crossovers to confirm signal strength.
- Price Action Confirmation: Wait for candlestick confirmation patterns after crossovers before entering.
- Higher Timeframe Alignment: Take crossover signals that align with the trend on higher timeframes.
- Add Momentum Filters: Use RSI or MACD to confirm momentum is consistent with the crossover direction.
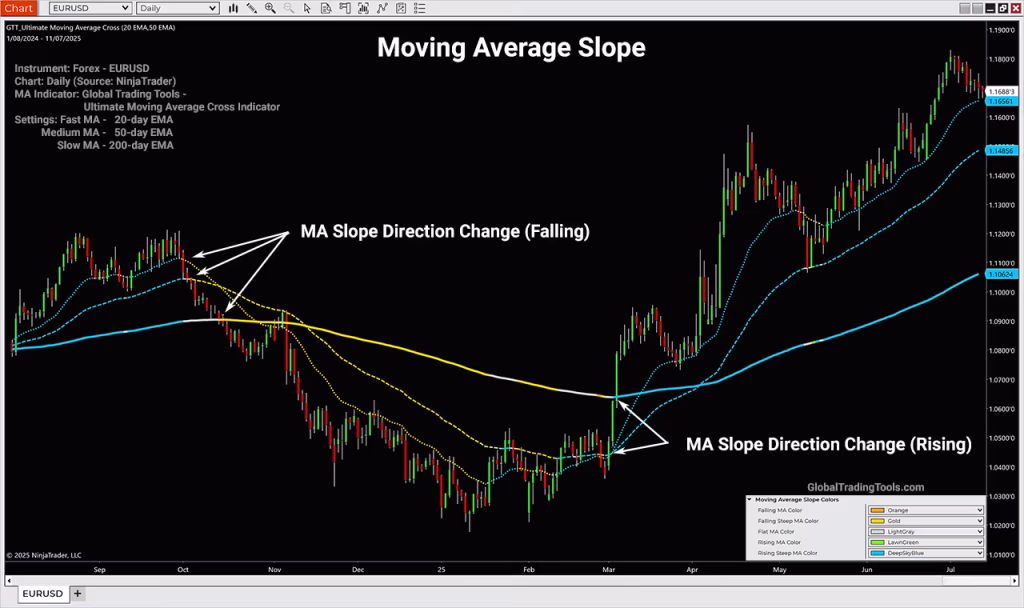
Moving Average Slope
While many traders focus on price crossing moving averages or moving averages crossing each other, the slope or angle of the moving average itself provides valuable information about trend strength and potential changes in market direction.
The Significance of Moving Average Slope
The slope of a moving average reveals crucial information about market momentum:
- Steep Upward Slope: Indicates strong bullish momentum
- Steep Downward Slope: Suggests powerful bearish momentum
- Flattening Slope: Warns of waning momentum and potential trend exhaustion
- Changing Direction: Often precedes price reversals
Trading Strategies Based on Slope Analysis
Effective trading strategies can be built around moving average slope analysis, including:
MA Slope Direction Change Strategy
- Monitor the slope of a relevant moving average (often 20-50 periods)
- Enter long positions when the slope turns from negative to positive
- Enter short positions when the slope shifts from positive to negative
- Exit when the slope flattens or reverses again
Slope Steepness Strategy
- Measure the angle or rate of change of the moving average
- Enter in the direction of the trend when the slope exceeds a threshold angle
- Add to positions when the slope steepens further
- Reduce exposure when the slope begins to flatten
- Exit completely when the slope approaches zero or reverses
Slope Divergence Strategy
- Compare the slopes of multiple moving averages (e.g., 20 and 50-period)
- Look for divergences where shorter MA slope weakens while price continues trending
- Prepare for potential reversals when slope divergences appear
- Confirm with price action before entering counter-trend positions
Calculating Moving Average Slope
Several methods exist to quantify moving average slope:
- Visual Assessment: Simply observe the angle on charts
- Rate of Change (ROC): Calculate the percentage change in the MA value over a specific period
- Linear Regression Slope: Apply statistical linear regression to the moving average line
- Moving Average of Moving Average: Calculate a second moving average of the first to smooth the slope changes
Practical Applications
Incorporating slope analysis into how to trade with moving averages:
- Trend Strength Confirmation: Use slope steepness to gauge trend strength before entering positions
- Early Warning System: Watch for flattening slopes as an early indication of potential trend exhaustion
- Position Sizing: Allocate larger position sizes to trades when the moving average slope is steeper in the trade direction
- Filter for Other Strategies: Use slope direction as a filter for other moving average strategies like crossovers or bounces
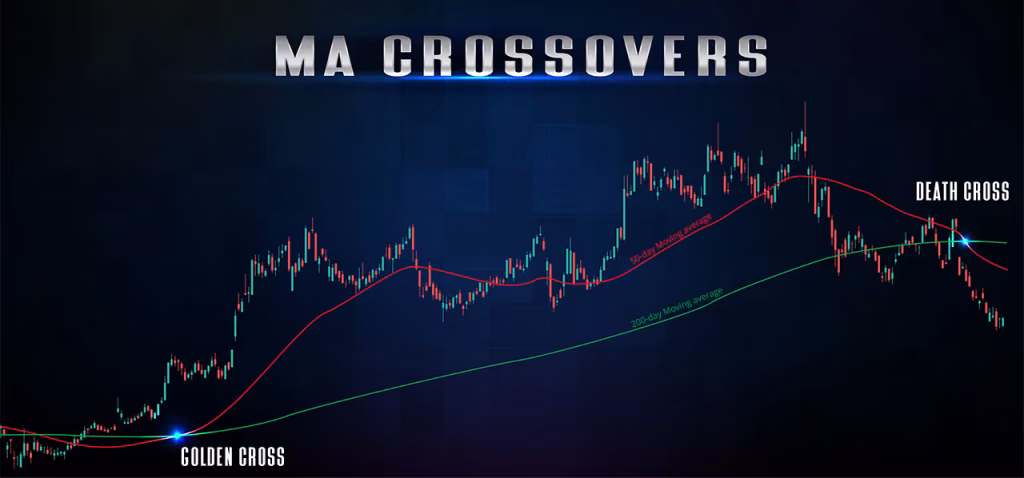
Golden Cross Pattern Explained With Examples and Charts
The Golden Cross represents one of the most powerful and widely recognized bullish patterns in technical analysis (the Death Cross is the opposite of the details below). This bullish pattern occurs when a 50-day (shorter-term) moving average crosses above a 200-day (longer-term) moving average, signalling a potential shift from a bearish to a bullish trend.
While various moving average combinations can form a Golden Cross, the most classic and widely followed involves the 50-day SMA crossing above the 200-day SMA.
Anatomy of the Golden Cross
A complete Golden Cross formation consists of three stages:
- Downtrend Phase: Initially, both moving averages are declining, with the shorter MA below the longer MA, confirming a bearish trend.
- Crossover Phase: The shorter MA crosses above the longer MA, signaling the potential trend reversal. This is the actual “Golden Cross” event.
- Confirmation Phase: After the crossover, both moving averages begin to slope upward, with the shorter MA remaining above the longer MA, confirming the new bullish trend.
Market Psychology Behind the Pattern
The Golden Cross reflects important shifts in market psychology:
- The 200-day MA represents the long-term market sentiment, showing the average price investors have paid over approximately 9-10 months.
- The 50-day MA captures intermediate-term sentiment, reflecting more recent price action.
- When the 50-day crosses above the 200-day, it indicates that recent sentiment has become more bullish than long-term sentiment, suggesting a potential shift in market direction.
Trading the Golden Cross
Several approaches exist for trading with MA crossovers like the Golden Cross:
Traditional Approach
- Enter long positions when the 50-day SMA crosses above the 200-day SMA
- Place stop-loss orders below a recent swing low or the 200-day MA
- Hold the position until a Death Cross occurs (50-day crossing below 200-day)
Enhanced Approach
- Wait for the crossover to occur
- Look for a pullback toward the 50-day MA after the cross
- Enter when price bounces off the 50-day MA, confirming it as new support
- Use tighter stops based on the 50-day MA
Conservative Approach
- Require both MAs to be sloping upward after the cross
- Wait for price to make a higher high and higher low after the cross
- Enter on a pullback that holds above both MAs
- Use trailing stops based on subsequent swing lows
Golden Cross Performance
Historically, the Golden Cross has demonstrated significant predictive power in major market indices:
- In the S&P 500, Golden Crosses have preceded many major bull markets
- On average, returns following Golden Crosses can exceed market averages
- The pattern tends to be more reliable in indices than in individual stocks
- Performance is strongest when confirmed by increasing volume and other technical indicators
Limitations and Considerations
Despite its popularity, traders should be aware of several limitations:
- As a lagging indicator, the Golden Cross occurs after a substantial move has already taken place
- False signals can occur, particularly in choppy or ranging markets
- The pattern works best in conjunction with other confirming indicators
- Different markets and timeframes may require adjustments to the moving average periods
Real-World Examples
Recent notable Golden Cross examples include:
- March 2019 S&P 500: After the late 2018 correction, a Golden Cross in March 2019 preceded a strong rally until the pandemic crash in 2020.
- June 2020 S&P 500: Following the Covid-19 market crash, a Golden Cross in June 2020 signalled the beginning of a new bull market that lasted until 2022.
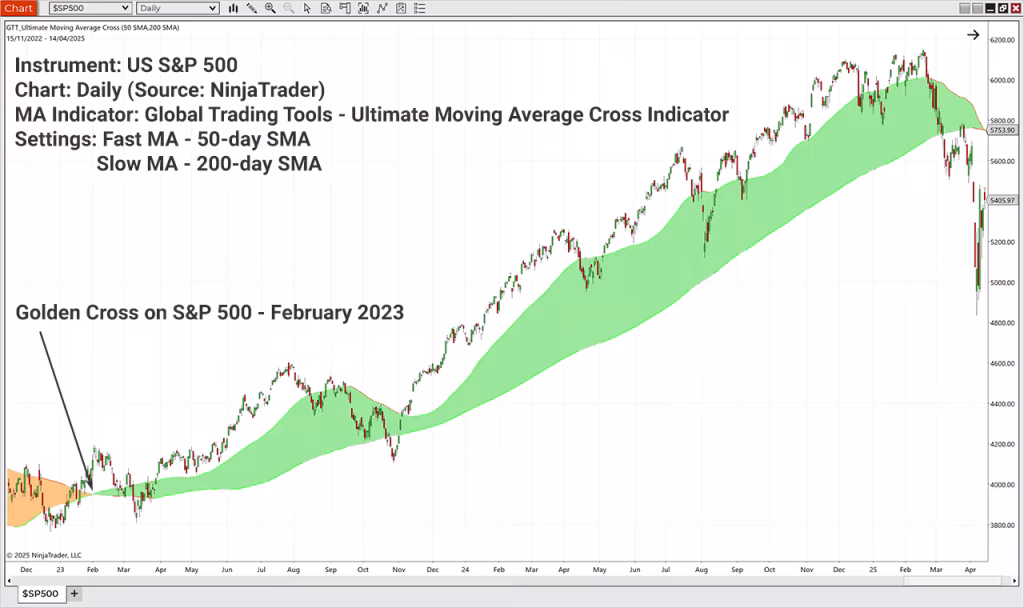
- February 2023 Bitcoin: After the crypto winter of 2022, Bitcoin formed a Golden Cross in February 2023, preceding a significant recovery rally.
- February 2023 S&P 500: After the 2022 macro-correction, a Golden Cross in February 2023 preceded the beginning of a new bull market that lasted 2 years (until March 2025). See image below…
Combining Moving Averages with Other Technical Indicators for Improved Trading
Moving averages reach their full potential when combined with market structure and complementary indicators that address their limitations while enhancing their strengths.
Moving Averages and Oscillators
Pairing moving averages with oscillators like the RSI (Relative Strength Index) or Stochastic indicator creates a powerful combination. Moving averages identify the trend direction, while oscillators help time entries and exits by indicating potential overbought or oversold conditions. This approach is particularly effective for trading with moving average crossovers when the crossover occurs in the direction of the main trend and the oscillator indicates room for price movement in that direction.
Volume Confirmation
Volume indicators provide crucial validation for moving average signals. Strong volume accompanying a moving average crossover suggests greater conviction behind the move, potentially indicating a more reliable signal. Conversely, crossovers occurring on light volume might warrant caution.
Moving Averages and Support/Resistance Levels
Combining moving averages with traditional support and resistance levels creates high-probability trading zones. When a moving average coincides with a key support or resistance level, that area gains additional significance. Traders often look for bounces or breaks at these confluence points.
Candlestick Patterns and Moving Averages
Day trading with candlesticks and moving averages represents a classic technical approach. Candlestick patterns provide reversal or continuation signals, while moving averages confirm the broader trend context. For example, a bullish engulfing pattern occurring at a rising 20-day moving average offers a stronger signal than the candlestick pattern alone.
Bollinger Bands and Moving Averages
Bollinger Bands use a moving average as their middle band, with upper and lower bands representing standard deviations from this average. This combination helps traders identify both the trend (via the moving average) and potential overbought/oversold conditions (via the bands), offering a more complete picture of market conditions.
Moving Average Convergence Divergence (MACD)
The MACD itself is constructed from moving averages, typically the difference between the 12-day and 26-day EMAs. Adding this indicator to your moving average analysis provides insights into momentum and potential trend changes that might not be immediately apparent from price action alone.
How to Avoid the Most Frequent Mistakes in Moving Average Trading
Despite their apparent simplicity, moving averages can lead traders into several common pitfalls. Understanding these mistakes is crucial for effective implementation of moving average strategies.
Treating Moving Averages as Precise Entry/Exit Signals
Moving averages work best as trend identification tools rather than precise entry/exit signals. Treating every moving average crossover as a trading signal often leads to numerous false signals and “whipsaws,” particularly in ranging markets. Instead, use moving averages as one component of a comprehensive trading plan that includes other confirmatory indicators or price action analysis.
Using Inappropriate Timeframes
The effectiveness of a moving average depends significantly on matching it to your trading timeframe and style. Using a 200-day moving average for day trading decisions or a 5-day moving average for long-term investment choices creates a mismatch that can lead to poor results.
Ignoring Market Context
Moving averages perform differently depending on market conditions. They excel in trending markets but generate misleading signals in ranging or choppy markets. Learning to detect range trading with moving averages is essential—when price oscillates around a flat moving average, it often indicates a rangebound market where trend-following strategies should be avoided.
Relying on a Single Moving Average
Using just one moving average provides limited information. Multiple moving averages of different lengths offer more comprehensive insights into market structure. For example, to swing trade with the triple moving average trading system, this leverages three different moving averages to confirm trends and generate more reliable signals.
Overlooking Moving Average Types
Different types of moving averages (SMA, EMA, WMA) have distinct characteristics! Using the wrong type for your trading style can impact results. Generally, EMAs respond more quickly to price changes, making them suitable for shorter-term trading, while SMAs provide smoother signals for longer-term analysis.
Curve-Fitting and Optimization Errors
This is an error many traders make with all sorts of technical analysis indicators. Excessively optimizing moving average periods to fit historical data often leads to strategies that fail in live trading. While some optimization is beneficial, ensuring your moving average strategy works reasonably well across different market conditions and timeframes is more important than finding the “perfect” settings for a specific historical period.
Conclusion
Moving averages stand as foundational tools in technical analysis, offering traders a versatile approach to understanding market trends and developing profitable strategies. From simple trend identification to complex multi-timeframe systems, moving averages provide clarity in chaotic markets by filtering noise while highlighting the underlying direction.
Throughout this guide, we’ve explored how to trade with moving averages across various applications—from identifying trend changes with crossovers to timing entries with slope analysis and managing risk with proper indicator combinations. We’ve seen how techniques like trading with moving average crossovers and how to swing trade with the triple moving average trading system can be applied to different market conditions and trading styles.
The most successful traders recognize both the strengths and limitations of moving averages. While these indicators excel at identifying trends and potential support/resistance levels, they work best when complemented by other analytical tools and sound risk management practices. Understanding when to enter a trade with moving averages requires not just technical knowledge but also psychological discipline to avoid common pitfalls like overtrading crossovers or ignoring market context.
Whether you’re a day trader implementing strategies for day trading with candlesticks and moving averages or a swing trader looking to capture intermediate trends, moving averages provide a framework for objective decision-making. The key to success lies in selecting the appropriate moving average types and periods for your timeframe, testing your approach thoroughly, and consistently applying your strategy with proper risk controls.
By mastering the concepts presented in this guide and committing to ongoing learning and refinement, traders can harness the full potential of moving averages to navigate financial markets with greater confidence and consistency.
Last updated: January 29, 2026