The only moving average and crossover alert indicator you’ll ever need!
Our Ultimate Moving Average Crossover Alert indicator bundle for the NinjaTrader platform not only alerts you when a pair of moving averages cross, or price crosses a moving average, through an extensive range of audio, visual and email alert notifications, but also provides a suite of additional features.
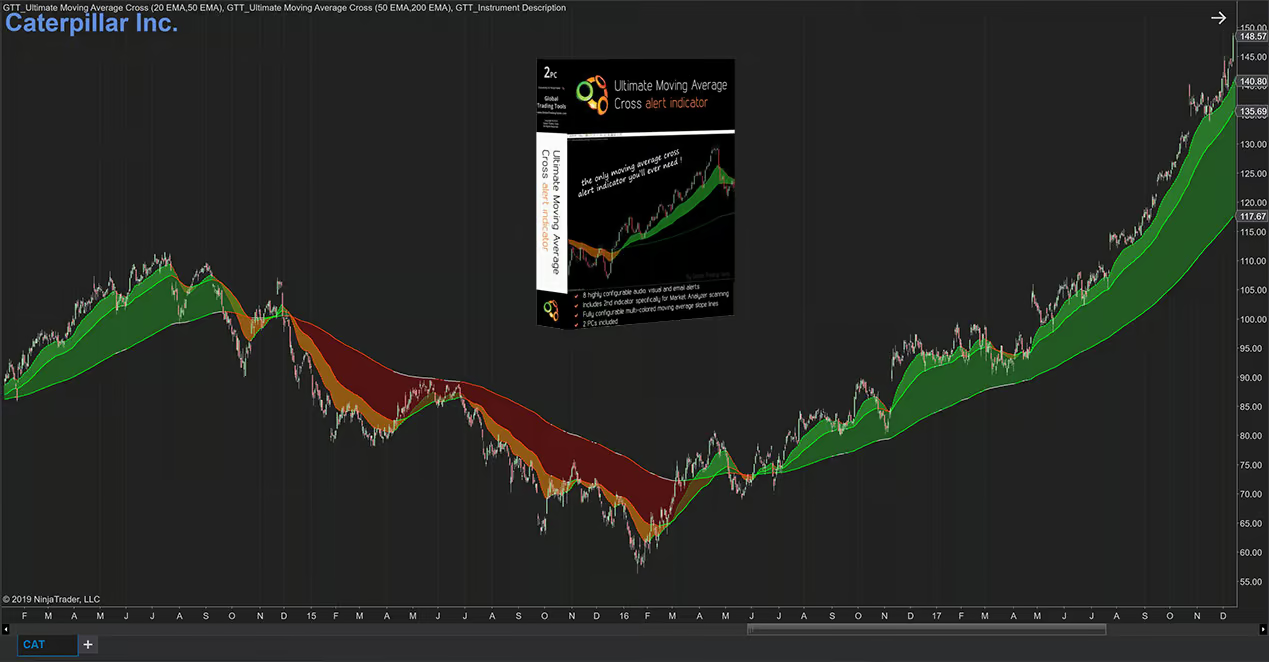
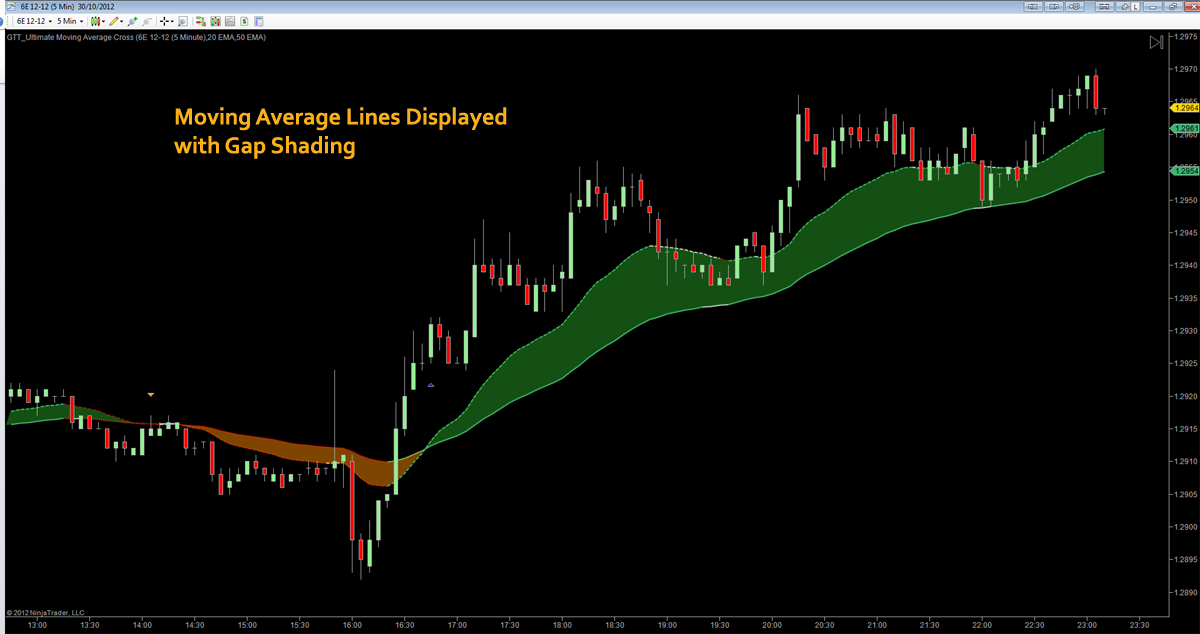
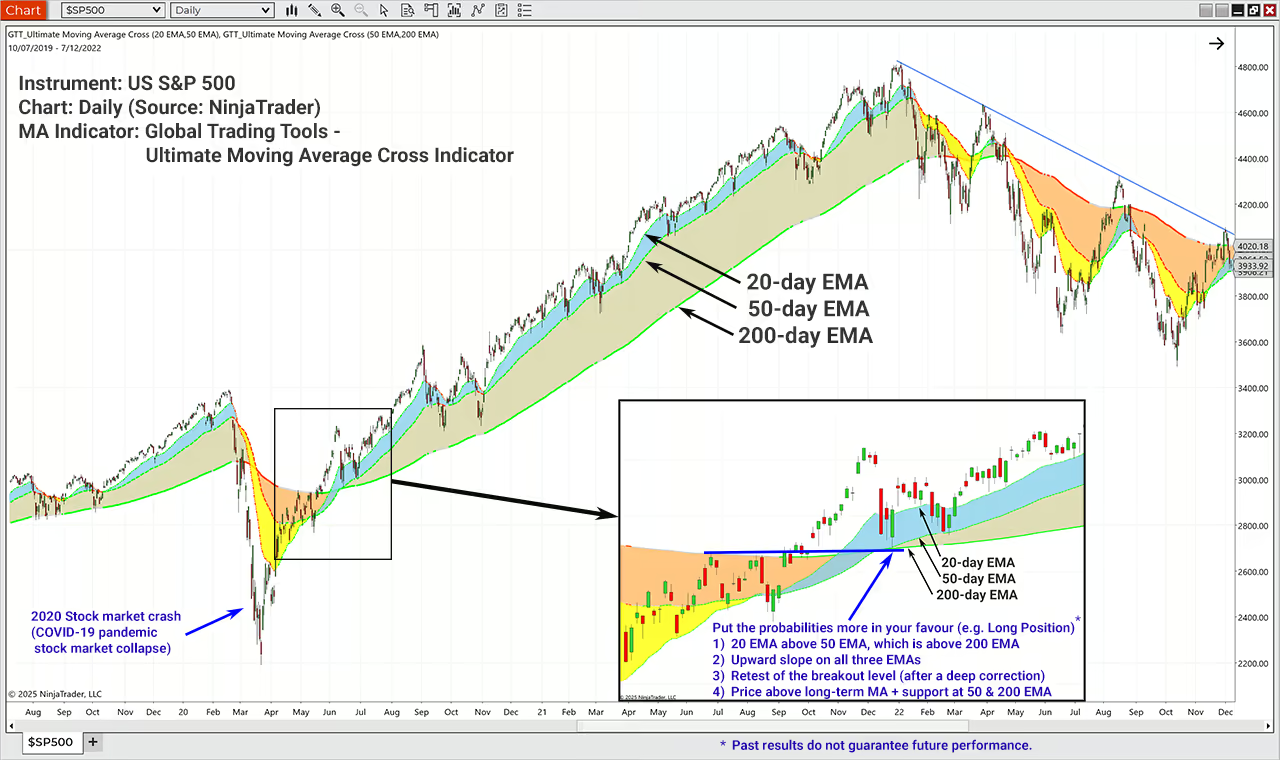
- Unique moving average 'clouds' (see Before/After image below)
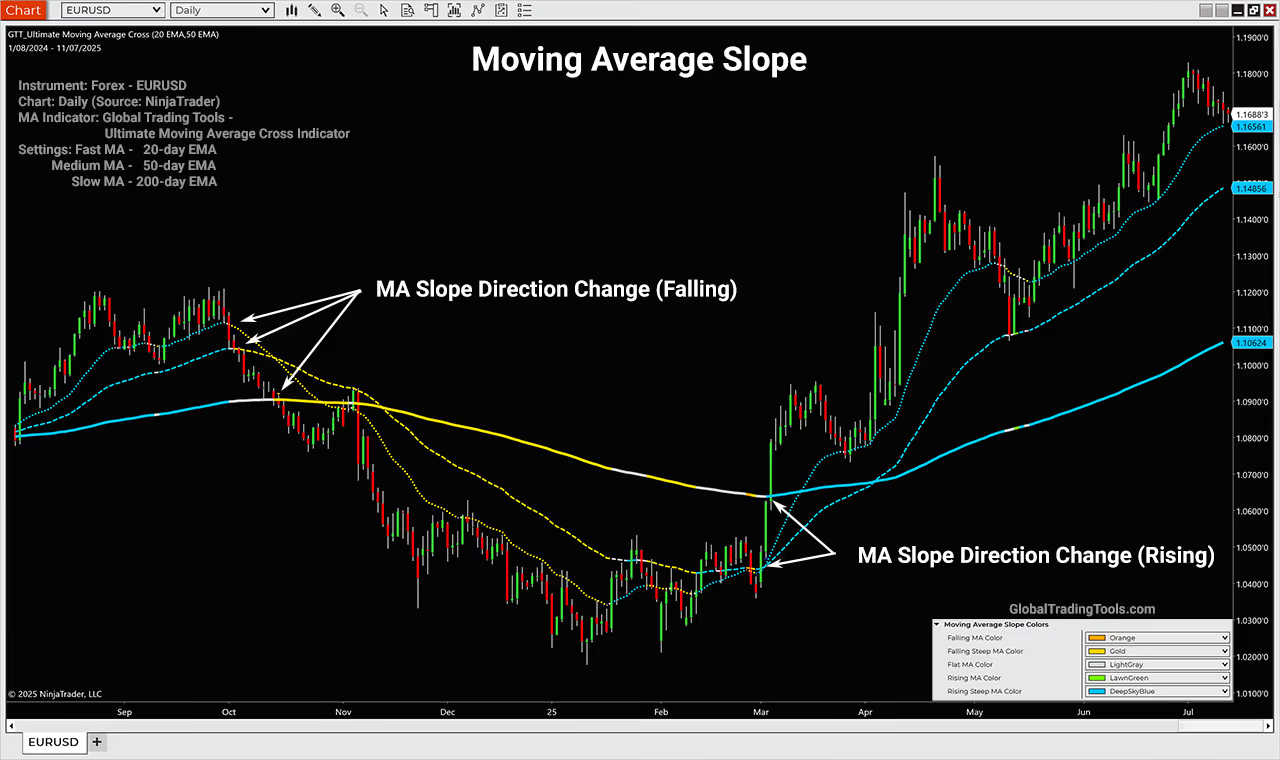
- Moving average slope colour change (5 stages)
- Twelve individually selectable moving average ("MA") types
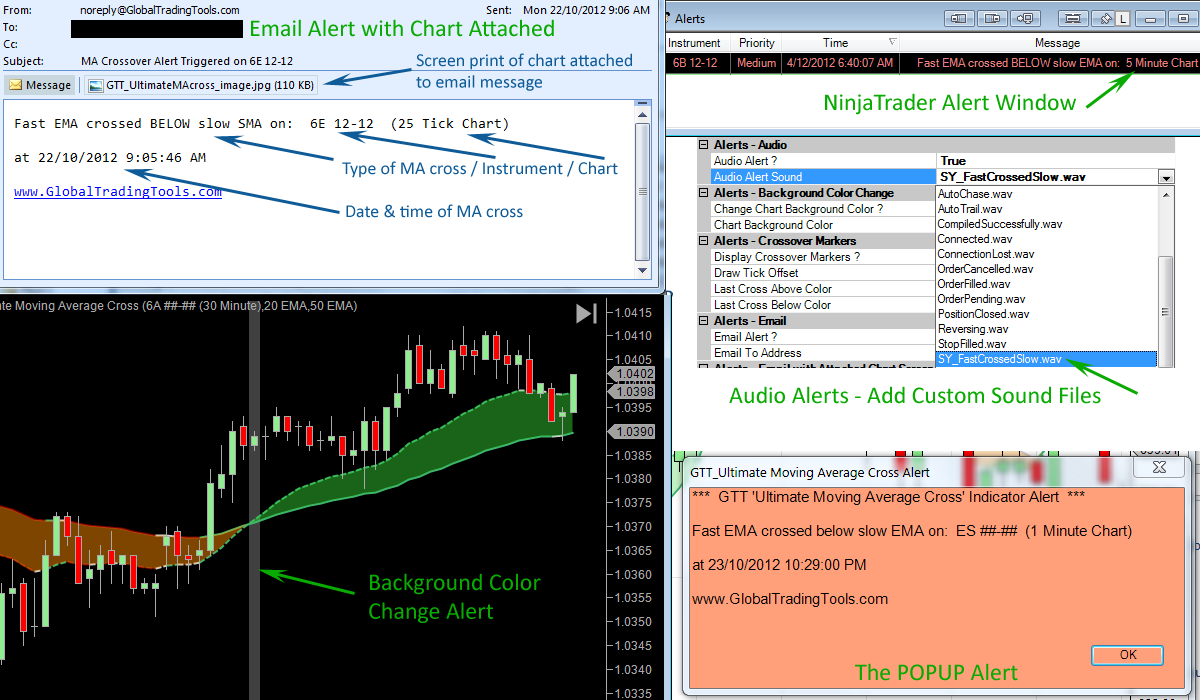
- Eight different alert types (including email alerts)
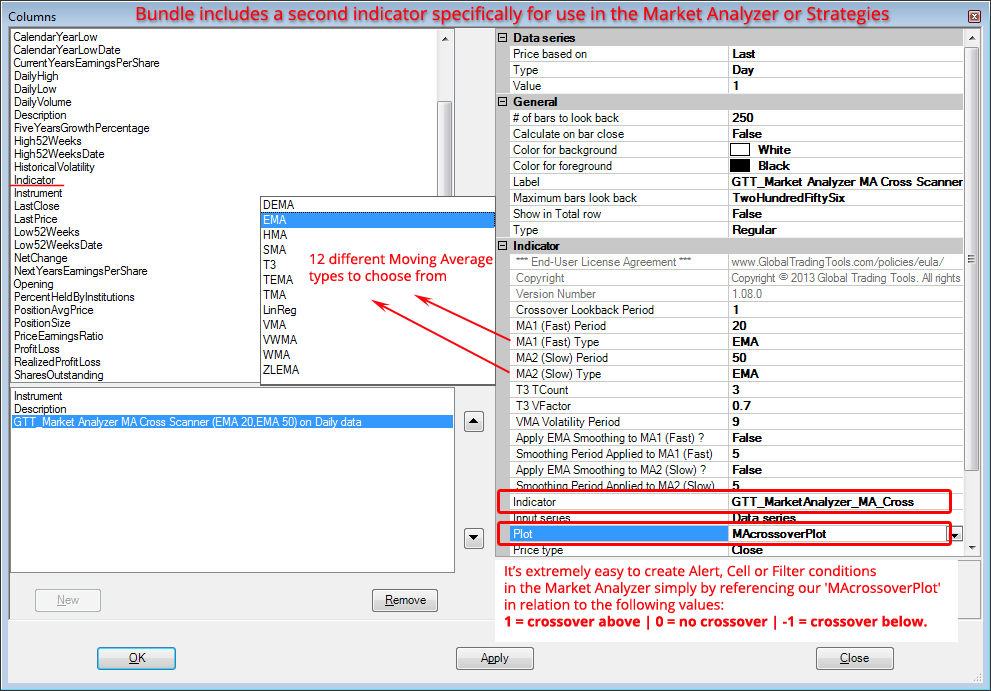
- Receive two indicators for the price of one
- One indicator for your NinjaTrader charts
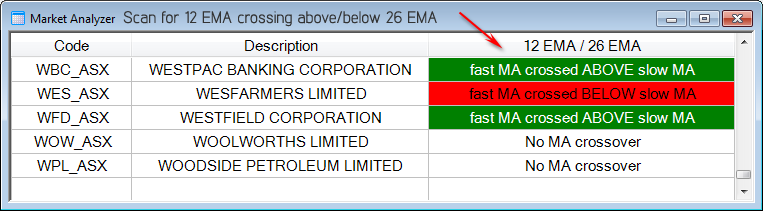
- Plus a second indicator for scanning in the Market Analyzer or for use in Automated Strategies


Benefits of using our Moving average indicators
- Never Miss a Signal – Instantly spot when price or moving averages cross with customizable audio, visual, and email alerts.
- See Trends Clearly – Unique moving average clouds and five-stage slope color changes reveal market momentum at a glance.
- Trade Your Way – Choose from 12 different moving average types and 8 alert options to match your strategy perfectly.
- Powerful Flexibility – Includes two indicators: one for your NinjaTrader charts and another for Market Analyzer scanning or automated strategies.
- All-in-One Solution – With unmatched visualization, alerts, and automation tools, this truly is the only moving average and crossover alert indicator you’ll ever need.
Moving average crossover indicator features for NinjaTrader 8
With moving average ‘cloud’ display, 12 individually selectable MA types, 8 different alert types, and a second indicator included specifically for use in Market Analyzer scanning or strategy development, we believe this is the best moving average crossover indicator on the market.
Moving Average Crossover Alerts
- Crossover Markers on Chart
- Audio Alert (inc. custom sounds)
- Email & Alerts Window
- MA Slope Colour Change
- Coloured MA 'Cloud'
- Change Chart Background
- Market Analyzer Scanner
- Include in NinjaTrader Strategy
What does a Moving average cross tell you?
A moving average (MA) indicator is a popular technical analysis trading tool that smooths out price data by creating a constantly updated average price, over a specific time period. Used as a single line by itself, a moving average is often overlaid on price charts to indicate price trends. However, trading with moving averages can be so much more. From multiple moving average strategies, MA slope, expansion or contraction of the averages, price relative to the MA, finding confluence of factors when moving averages align with market structure, chart patterns, technical indicators, volume and much more.
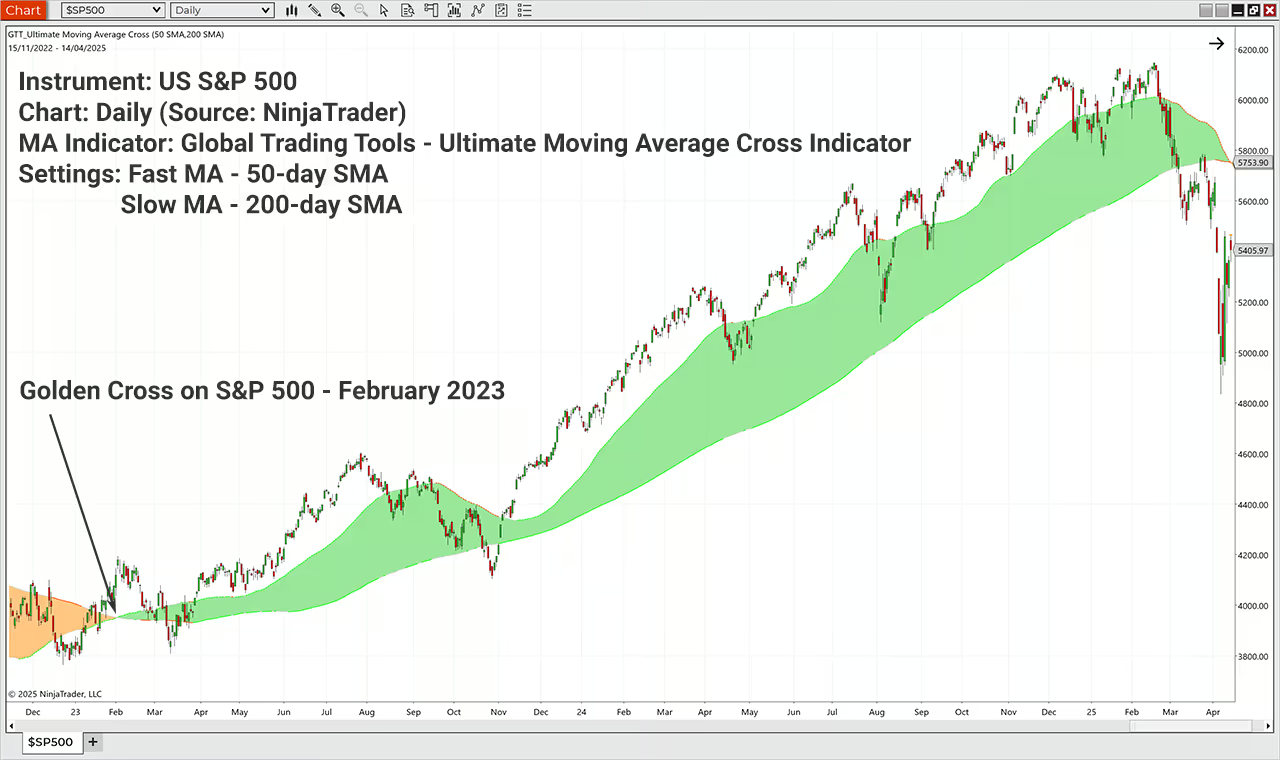
A Moving average crossover occurs when a faster MA (a shorter-period moving average) crosses a slower MA (a longer-period moving average). In other words, this is when the shorter-period MA line crosses a longer-period MA line. In trading & investing, this meeting point can be used to signal a change in trend or market structure.
Price crossovers occur when the price of an asset close above or below a moving average and are commonly used by traders to identify shifts in momentum, especially in a trending market.
I always check my charts and the moving averages prior to taking a position.
Is the price above or below the moving average?
That works better than any tool I have. I try not to go against the moving averages; it is self-destructive.~ Marty Schwartz in Market Wizards: Interviews with Top Traders by Jack Schwager
Get on the right side of the trend today to maximise returns.
Easily see changes in your moving averages with our customisable MA slope colours.
Moving average indicator uses - Technical analysis
Different traders use moving averages for different reasons. Some use them as their primary analytical tool, while others simply use them as a confidence builder to back up their investment decisions.
If you’re using price or moving average crossovers in any part of your trading strategy, you know how critical it is to be alerted as soon as a crossover happens, or to be easily able to scan a range of financial instruments for recent MA crosses!
Best Moving average indicator crossover alert features
- Audio Alert (ability to add custom sounds)
- Crossover marker on chart for last moving average cross above and below
- Change chart background color for bars where a crossover occurs
- Email messaging (direct from chart OR the Market Analyzer!)
- Messages sent to NinjaTrader Alerts Window (with configurable message priority)
- Color the Moving Average ‘Cloud’
- Includes a second indicator specifically for use within the Market Analyzer for creating Alert, Cell or Filter conditions, or for programming into a NinjaTrader Strategy
- Moving average crossover scan / screener
- Great as a technical stock screener. For example, find stocks above a 20 day moving average, stocks crossing 50 day moving average, 200 day moving average strategy alerts etc.
- Receive email alerts direct from the Market Analyzer scan when crossing moving averages are detected

- Fully configurable moving average ‘cloud’
- Choice to turn on or off the moving average cloud display on charts
- Fully configurable multi-colored moving average slope lines
- Choice to turn on or off the moving average lines display on charts
- 12 different Moving Average Types, individually selectable for each moving average, including:
- DEMA – Double Exponential Moving Average (developed by Patrick Mulloy and described in his article in the January, 1994 issue of Technical Analysis of Stocks and Commodities magazine)
- EMA – Exponential Moving Average (our indicator is commonly used as a 2 EMA cross indicator)
- HMA – Hull Moving Average (developed by Alan Hull)
- LinReg – Linear Regression (although not a moving average, the linear regression indicator is often used for trend identification in a similar fashion to moving averages)
- SMA – Simple Moving Average
- T3 – T3 Adaptive Moving Average (created by Tim Tillson)
- TEMA – Triple Exponential Moving Average (developed by Patrick Mulloy and described in his article in the January, 1994 issue of Technical Analysis of Stocks and Commodities magazine)
- TMA – Triangular Moving Average
- VMA – Variable Moving Average (also known as VIDYA or Variable Index Dynamic Average)
- VWMA – Volume Weighted Moving Average
- WMA – Weighted Moving Average
- ZLEMA – Zero-Lag Exponential Moving Average
- Moving Average Period – individually selectable for each moving average
- 7 different price type inputs
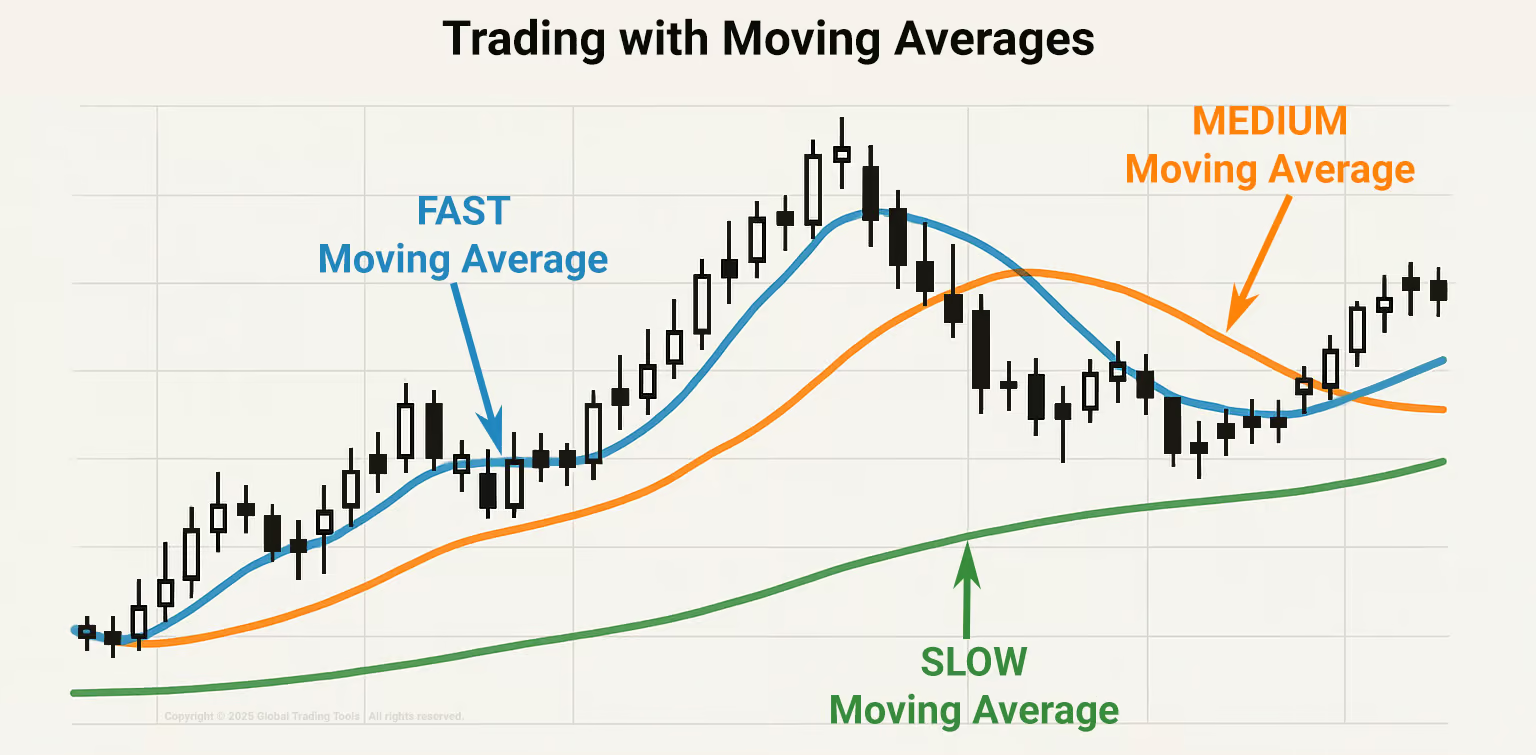
- Ability to display a third long-term moving average
- Detailed User Manual
- Pre-configured & easy to use, yet highly configurable for “power users”
- Receive both NinjaTrader 8 versions of the indicators (MA chart and MA market analyzer indicators) for the ONE price!
- BONUS: Your license allows use on TWO computers you own (eg your desktop PC and a laptop)
- This is the best deal on the best technical indicator for finding crossing moving averages.
If you find a better price on an indicator for NinjaTrader with all the features ours has and allows you to activate on 2 computers, then we will better their price once you send us the competitor’s product link and we can verify the features online.

- NinjaTrader – Ultimate Moving Average Crossover Alert Indicator is a plug-in to the NinjaTrader charting platform, so any system which can run NinjaTrader (version 8 supported) can also run the Ultimate Moving Average Cross Alert Indicator. For more information on NinjaTrader requirements, it is best to refer to the official NinjaTrader Installation Guide: NinjaTrader 8 Installation Guide
- Microsoft .NET Framework 4.8 (pre-installed on most PC’s) or higher. To find the latest version of Microsoft .NET Framework, see: https://dotnet.microsoft.com/en-us/download
- All customers receive a perpetual license and free access to 1 year (from purchase date) of support and software updates, including future enhancements. Your license allows use on TWO computers you own (eg your desktop PC and a laptop). If you require installation on more than 2 computers, additional computer licenses can be purchased for a significant discount with the initial purchase.
- The perpetual license is for your ongoing use of the software, and there is no more to pay if you do not wish to receive any future software updates/releases after the first year. All customers receive free access to 1 year of support and software updates, including future enhancements, however after 1 year, future updates & enhancements will be available at a discounted rate of 15% of the listed price for an additional 1 year of support and software updates, including future enhancements, should you wish to take up this option.
- PLEASE NOTE: By clicking “I agree to the Terms & Conditions” when purchasing the product, downloading, accessing, installing, running, or using the Global Trading Tools (GTT) indicator you are indicating your acceptance of the terms and conditions contained in the Disclaimer and End User License Agreement (EULA) located at www.globaltradingtools.com/policies/
Get on the right side of the trend now
Own your Ultimate Moving Average Crossover Alert indicator outright with a perpetual license for ONLY (US) $197.00 (includes 1 year of support and updates).
BONUS: Includes license for TWO computers you own (eg your desktop PC & laptop).
BUY NOW
Ultimate Moving Average Cross Alert Indicator bundle for NinjaTrader 8
 Includes:
- Two (2) indicators. One for your NinjaTrader charts and one for the NinjaTrader Market Analyzer or NinjaTrader strategies;
- 1 year of support and updates;
- License for two (2) of your own computers (eg. desktop and a laptop); and
- Detailed manual.
Client Feedback & Reviews
Testimonials appearing on this website may not be representative of other clients or customers and are not a guarantee of future performance or success.
I like your work as it is clean and has needed parameters.
This is the first time in my 41-year career that I have decided to provide a testimonial related to a trading indicator or service. The reasons are:
1) The Ultimate Moving Average Cross Bundle from Global Trading Tools is the only moving average and crossover alert indicator you’ll ever need. Bar none.
2) Extremely well coded, with no issues, freezes, etc., that even well-known indicator providers fail to deliver for the NT platform. And I have used hundreds.
3) Make no mistake, the GTT MA Bundle is the most accurate indicator of trend, direction, and momentum. This is a statement made by someone who has been trading financial markets since 1984, so I have applied all sorts of indicators under the sun of Technical Analysis.
4) Last, the service provided by GTT is straightforward and extremely professional, from the assistance to the manual provided, with no upsales.
5) In summary, a gem in the industry of service providers for retail traders.
Thank you very much for such well coded indicator and I wish you the success you deserve.
I appreciate it.
all I can say is LOVE IT... LOVE IT.... LOVE IT.
Thank you and your programmers for all the hard work
This is a really good indicator.
I am certain that if you give this kind of REAL help, your business can not help but prosper.
Thank you heaps
Watch this short video to see our moving average indicator in action...
Common FAQs about our NinjaTrader MA Indicator Bundle
A moving average crossover is a technical analysis signal that occurs when two moving averages of different time periods intersect on a price chart. This is generally when a shorter-term moving average crosses above or below a longer-term moving average, and is used by traders to identify potential shifts in market trends.
Overall, moving average crossovers are popular due to their simplicity and effectiveness in helping traders identify potential market trends and make trading decisions accordingly. However, like all technical indicators, they can produce false signals, so risk management and additional confirmation methods (including market structure) are advisable.
Moving averages are powerful tools in technical analysis that can effectively illustrate trend strength and momentum. Here's how they achieve this:
1. Smoothing Price Data:
Moving averages smooth out price data over a specified period, reducing market noise and allowing traders to see the underlying trend more clearly. This smoothing helps identify whether the market is trending upward, downward, or sideways.
2. Trend Direction:
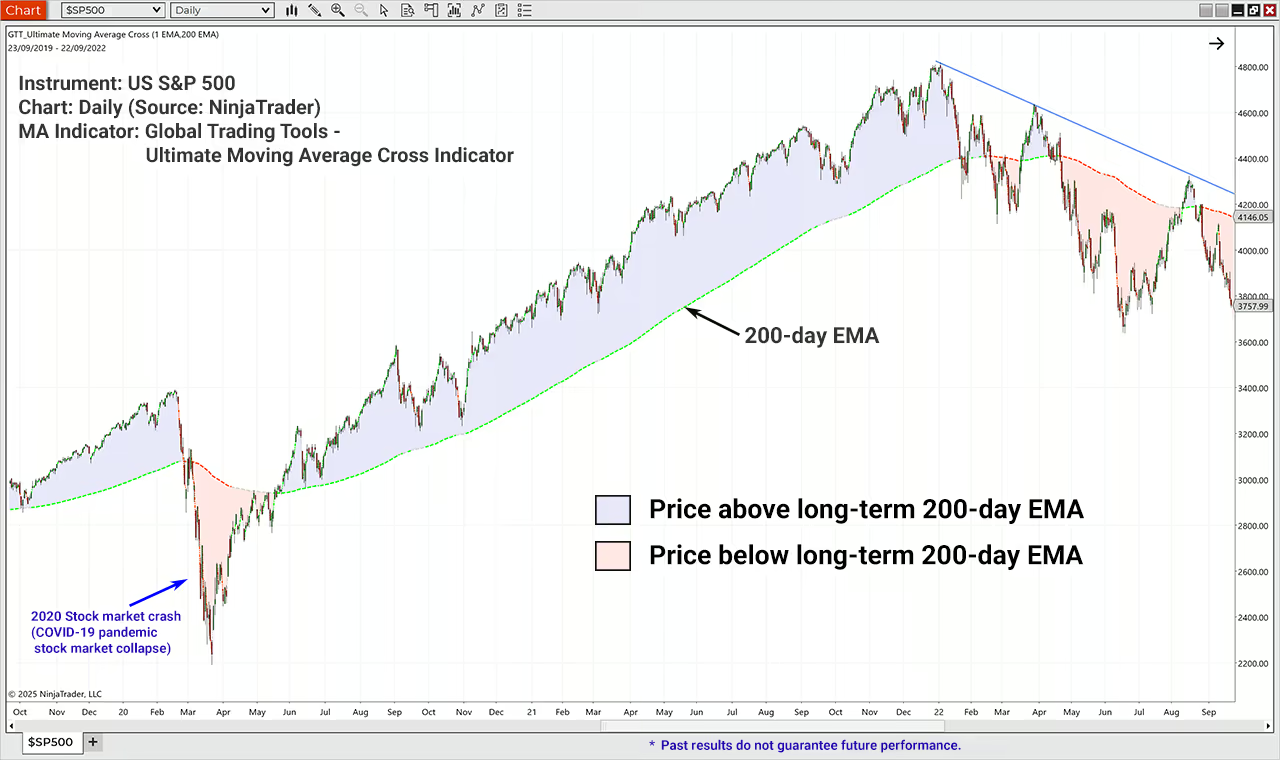
a) Position Relative to Price: The position of the moving average relative to the current price provides insight into trend direction. If the price is consistently above a moving average, it typically indicates a bullish trend, while prices below a moving average suggest a bearish trend.
b) Slope of the Moving Average: The angle or slope of the moving average itself indicates trend strength. A steep upward slope indicates strong bullish momentum, while a steep downward slope shows strong bearish momentum. A flat moving average suggests a lack of direction or weak trend.
3. Crossovers:
a) Bullish and Bearish Crossovers: When a shorter-term moving average crosses above a longer-term moving average (bullish crossover), it signals increasing upward momentum, suggesting that buyers are gaining strength. Conversely, when a shorter-term moving average crosses below a longer-term moving average (bearish crossover), it indicates increasing downward momentum as sellers take control.
b) Distance Between MAs: The distance between the short-term and long-term moving averages can also reflect trend strength. Wider gaps typically indicate stronger trends, while narrower gaps suggest weakening trends or potential reversals.
4. Dynamic Support and Resistance:
Moving averages can act as dynamic support or resistance levels during trending markets. In an uptrend, for instance, prices may retrace to test a rising moving average before continuing upward. The ability of the price to hold above the moving average signifies ongoing bullish momentum, while failure to do so may suggest weakening strength.
5. Indicating Trend Reversals:
Sudden shifts in the direction of a moving average can indicate potential reversals in trend strength. For example, if an uptrend begins to flatten out and then slopes downward, it may signal that bullish momentum is fading and that a bearish trend could be developing.
6. Combining with Other Indicators:
Moving averages are often used in conjunction with other indicators to provide insights into momentum and trend strength. For example, pairing moving averages with the Relative Strength Index (RSI) can help confirm trends. If prices are above a rising MA while RSI readings indicate overbought conditions, it may signal strong bullish momentum that could soon reverse.
Moving averages can reveal important aspects of trend strength and momentum through their smoothing properties, positional relationships with price, crossovers between different MAs, and their roles as dynamic support and resistance levels.
By understanding how these elements interact, traders can more effectively assess market conditions and make informed trading decisions that align with prevailing trends and momentum shifts.
While moving average (MA) crossovers can provide useful insights into potential market movements and trend changes, they should not be used in isolation as definitive entry or exit signals.
Traders are advised to consider market structure, utilise confirmation from other technical analysis methods, and assess the overall context before acting on a crossover signal. This multifaceted approach helps improve the accuracy of trading decisions and can reduce the risk of whipsaws when decisions are based solely on crossover events.
The area between a short-term and longer-term moving average forms the "cloud" in our technical indicator. The cloud can be shaded differently depending on the selected parameters.
It's also possible to add the indicator to the chart twice, with different MA settings and different MA cloud colours for each.
Absolutely!
Virtually every aspect of our indicators is customisable.
From significant aspects like which type of moving average to use (we offer 12 different types, including SMA, EMA, WMA, DEMA, HMA, TMA, VMA, ZLEMA and more) to the colours of the cloud and slope changes, most aspects can be customised to your preferences, trading style, and tailored alerts to suit your unique trade strategies.
Two.
You will receive one indicator that is specifically for use on NinjaTrader charts, and a second indicator that is specifically designed for use in NinjaTrader's Market Analyzer and automated trading strategies.
Yes, currently our indicators are only available for NinjaTrader, however, we are considering expanding to include Trading View and/or MetaTrader.
If you would like to see our indicators available on a platform other than NinjaTrader, please let us know via our contact form.
No, we don't sorry. However, our indicator features are fully detailed on this page, and a video is available to show it in use. We also offer a 30-day guarantee.
If, within 30 days of your purchase, you find a better price on an indicator for NinjaTrader 8 with all the features ours has, and allows you to activate it on 2 computers, then we will match or better their price once you send us the competitor’s product link, and we can verify the features online.
With a single one-time payment, you gain perpetual access to the current version of our indicators, eliminating the need for recurring subscription fees. Your purchase also includes a full year of support and updates, ensuring you have the latest features and assistance when you need it.
After the first year, you have complete flexibility—continue enjoying updates and support for just a small annual fee, or choose not to subscribe if you're happy with your indicator version and don't need any assistance from our support desk. The decision is entirely yours, allowing you to tailor your experience to fit your needs.
Two.
Unlike many other indicator developers, who only allow you to install indicators on one computer at a time, we realise that many traders these days have both a desktop and a laptop computer. We have therefore decided to include a two (2) computer license with your indicators.
Trading financial derivatives (including but not limited to Futures, Forex, CFDs and Options) contains substantial risk and is not suitable for everyone. An investor or trader could potentially lose all or more than the initial investment. Risk capital is money that can be lost without jeopardizing ones’ financial security or lifestyle. Only risk capital should be used for trading and only those with sufficient risk capital should consider trading.
Past performance is not indicative of future results. View Full Risk Disclosure.
NinjaTrader® is a registered trademark of NinjaTrader Group, LLC. No NinjaTrader company has any affiliation with the owner, developer, or provider of the products or services described herein, or any interest, ownership or otherwise, in any such product or service, or endorses, recommends or approves any such product or service.
Last updated: January 22, 2026